
By the end of week three, reactor bed temperature in zone 2 was 8 degrees above target during the mid-cycle oligomerization phase, and we did not yet know why. That was unplanned. We also spent two days checking thermocouple calibration before confirming the sensor was fine and the process was the variable. A first pilot campaign is more useful when it reports these details rather than presenting only a polished summary.
Our first extended pilot campaign ran for eight weeks at our facility in Zurich. We set out to test specific points: what we intended to prove, what the reactor actually did, and what the accumulated process data now tells us.
What We Set Out to Test
The first campaign was not intended to demonstrate commercial viability. We aimed to validate the methanol-to-jet process under continuous operation, stress-test the catalyst against real feedstock variability, and gather enough run data for our optimization layer to start building useful models. We achieved the first two reasonably well. The third remains ongoing.
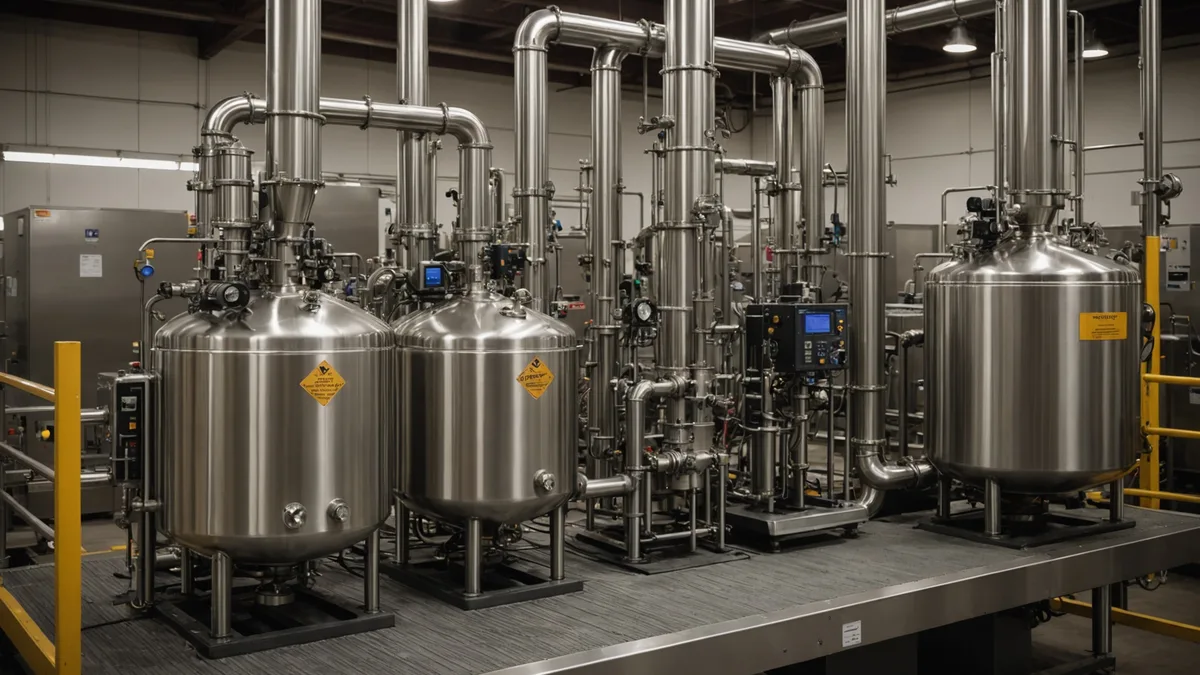
Our pilot reactor uses a fixed-bed catalytic system for the three-stage MtJ conversion: methanol dehydration and olefin formation in the MTO stage, oligomerization of the mixed olefin stream, then hydrogenation and fractionation to the jet cut. The chemistry is established in the literature. Less certain for a new facility is how its reactor geometry, feedstock, and heat management behave during continuous operation over weeks.
This campaign was the first step for our specific system. We are not saying it proves commercial readiness; we are saying it shows how this pilot behaves in operation.
For the campaign, we obtained green methanol from two suppliers: a biomethane reforming facility and a co-product methanol stream from a nearby biogas plant. Our specification required methanol purity above 99.5 percent, water below 500 ppm, and no detectable sulfur compounds. Two batches met specification; one arrived with 720 ppm water.
We deliberately used the out-of-specification batch after adding a controlled upstream drying step. We wanted to see how feedstock variation affected catalyst behavior in the first oligomerization stage. The effect was measurable but not catastrophic: selectivity for the C9 to C14 fraction fell slightly during the affected runs, then recovered within 18 hours after we returned to on-specification feedstock. Water content is now the highest-priority feedstock parameter for subsequent campaigns.
The sulfur specification is non-negotiable. Trace sulfur causes irreversible catalyst deactivation in oligomerization. Our protocol requires a mandatory GC-sulfur check on every incoming batch, not just supplier certificates.
Reactor Conditioning: The First Two Weeks
The first two weeks were devoted to catalyst conditioning, not productive operation. The heterogeneous catalyst needs a structured activation sequence before stable operation. We knew that from literature and prior engineering work. What those sources could not show was how our reactor's heat distribution would affect the conditioning timeline.
During conditioning, we found three distinct temperature zones in the reactor bed, although engineering calculations had predicted two. The third, at mid-bed, had lower local thermal mass than expected because of packing variation during catalyst loading. That created a temperature asymmetry which continued into early production and caused the week-three anomaly described at the start.
After identifying the cause, we adjusted the setpoint of the heat tracing circuit serving that zone. The temperature profile stabilized within 36 hours. The broader lesson is that even a carefully engineered pilot reactor can differ from its design basis in physical ways that only appear during operation.
When the Campaign Settled In
From week three onward, the reactor ran in a consistent regime. The MTO stage reached its target methanol conversion rates. Oligomerization selectivity toward jet-range hydrocarbons, specifically the C9 to C16 fraction, initially sat at the lower end of our target range and improved as the catalyst reached steady state by week five.
We measured jet-cut yield by mass at the end of each production cycle, which ran every 36 hours. Across 14 complete cycles, yields ranged from 28 to 37 percent on a methanol-input mass basis. This is internal pilot-scale benchmark data, not a commercial production projection. Variation across the 14 cycles shows which operating variables correlate most closely with yield, the information the optimization layer was built to extract.
During the settled production period, jet-cut quality remained consistent against the ASTM D7566 Annex A7 specification parameters we track. Freeze point, flash point, and density stayed within the expected ranges for an MtJ product. Aromatic content was near the lower edge of the specification window, as expected for a paraffinic synthetic fuel, and is addressed through blending at the point of use.
What the Software Accumulated
Our process control software recorded 240-plus distinct parameters in each production cycle: temperature profiles at 12 axial positions in the reactor bed, pressure drop across each stage, feed rate, recycle ratio, and online product-quality indicators. By campaign end, we had 14 complete cycles of structured data.
The optimization layer uses these records to create a run-specific model of the reactor's response surface. After 14 cycles, the model remains early, with wide confidence bounds at operating conditions near the edge of what we have tried. Its reliable output at this stage is feature-importance ranking, showing which of the 240-plus variables explain the most yield variance.
The first campaign makes process intuition more precise. The temperature setpoint in the mid-oligomerization zone explains a disproportionate share of yield variation compared with the other variables we tuned. Inlet feed rate and the recycle ratio in the hydrogenation stage follow. At this stage of the data history, the remaining variables are secondary noise.
What Held and What Did Not
The catalyst held. After eight weeks of continuous operation, end-of-campaign performance was not meaningfully different from week-five performance. Published aging curves for comparable catalysts led us to expect some deactivation, but we did not observe it at their predicted rates. Feedstock quality control, the eight weeks of campaign duration, or both may explain this. The second campaign will clarify it.
The heat management system needed more manual intervention than the design anticipated. Its automated heat-tracing control loop handled steady-state operation, but responded too slowly to the feed-rate transients we deliberately introduced during week six for process mapping. We are redesigning the control response logic for those conditions before the next campaign.
The process software's alert system performed as intended for the events that occurred. It flagged the zone-3 temperature anomaly before we saw it on the live dashboard and identified a minor pressure-drop increase in week seven, which proved to be a partially obstructed inlet screen. Both events were minor and caught early, and the thresholds set in advance were appropriate for this process at this scale.
The Honest Accounting
Eight weeks is enough to confirm continuous operation without catastrophic failure. It is not enough to characterize long-term catalyst deactivation, explore a meaningful share of the operating parameter space, or build the run history needed for high-confidence setpoint recommendations. We knew that before starting.
The first campaign was a baseline, not proof. The reactor held. The catalyst held. Data accumulated. Software identified the variables that matter most. That is the right outcome for a first campaign at a new facility.
The next campaign will run longer and vary parameters more deliberately to accelerate the optimization layer's learning. Before it begins, we are implementing the heat management changes identified here. The aim is structured coverage of more operating space, allowing the model to recommend conditions it has not directly observed.
An honest pilot record includes what happened as well as what worked. Both types of information help assess the practical and economic challenges of e-SAF production.
AI process control software for methanol-to-jet e-SAF production. Zurich, Switzerland.